It's been a long while since I've added anything new to this blog, for that I apologize. I do however have many unfinished projects that I have been working on over the past months, and since I had some time this weekend, I thought I would get around to finishing some of them. So here is a basic GUI script to make drawing shapes, or adding text to any plot easy! In addition to the basic marks and lines, this script also allows you to draw lightning bolts, stars, and bulls-eyes. To demonstrate this script, we first need to make a plot.
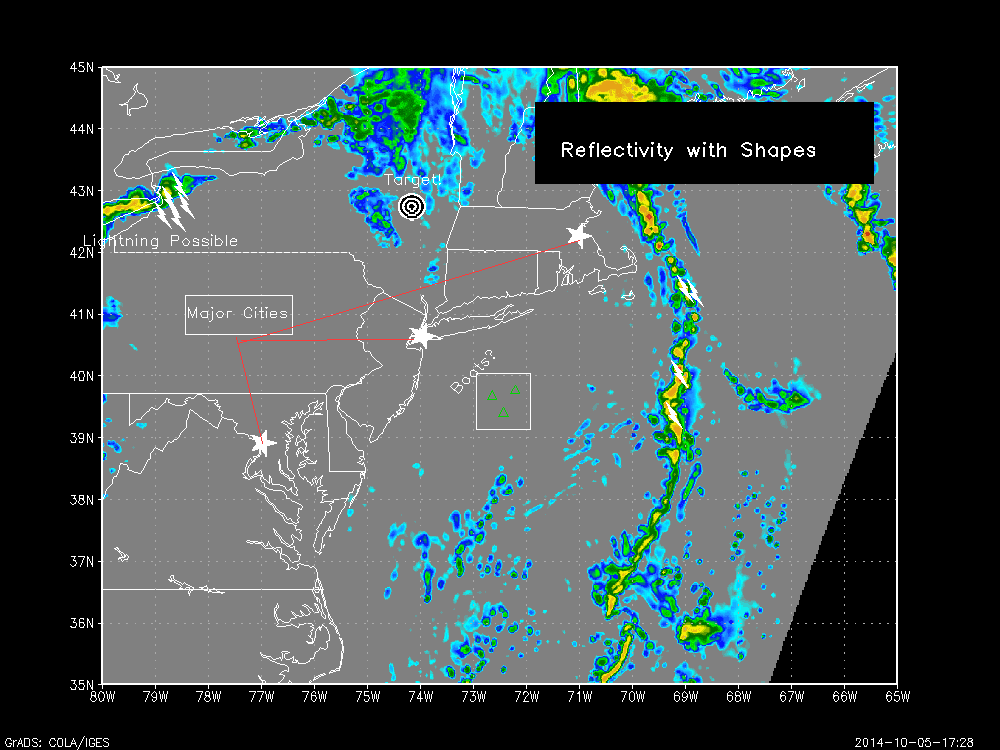
Since the HRRR data is now available on the GrADS Data Server, we'll use that. We will simply make a plot with model reflectivity. The two images below show the before and after of the plot using draw_shapes.gs.
Now, first the code to open the HRRR data from Oct 5th 2014 and plot the reflectivity (your plot may differ if you use a different data file):
file='http://nomads.ncep.noaa.gov:9090/dods/hrrr/hrrr20141005/hrrr_sfc_02z'
'clear'
'sdfopen 'file
'set gxout shaded'
'set mpdset hires'
'set lat 35 45'
'set lon -80 -65'
'set t 5'
'color 5 75 1 -kind gray->cyan->dodgerblue->blue->lime->green->darkgreen->yellow->goldenrod->orange->firebrick->red->darkred->fuchsia->indigo->white'
'd refcclm'
Once we have this set up, we run draw_shapes.gs. This will bring up a few buttons up top that will look something like this.
Once you have this open, you just navigate through the buttons to add shapes as you need to. Unfortunately, I have not yet added some easy options to change some of the basic aspects of your shapes, like color or size or thickness. If you want to toggle these, I put a list of options at the top of the script for you to toggle these settings (see below).
* ***SET INITIAL VALUES***
** DEFAULT MARK VALUES**
mtype=3 ;*Mark Type (Changeable within script)
mcol=3 ;*Mark Color
msize=0.12 ;*Mark Size
* Default Line Styles
lcol=2 ;*Line Color
lstyle=1 ;*Line Style
lthick=2 ;*Line Thickness
*Default Box Styles
blcol=1 ;*Outline Color
blstyle=1 ;*Outline Style
bfcol=0 ;*Fill Color
*Default String Styles
scol=1 ;*String Color
strsiz=0.12 ;*String Size
*Default Output files
imgfile='img.png'
xpix=1000 ;*Size of png Image
ypix=750
*****
***** Special Marks *****
len=0.15 ;*Size of Special Marks
light_col=1 ;*Lightning Color
star_col=1 ;*Star Color
*********************
It is likely that in version 2.0 I will add buttons to toggle at least size and color so you can have shapes and marks of different sizes on the same plot.
Aside from that, this seems to work pretty well. I have done some testing, I tried to have the buttons set automatically based on the size of the plot, so that they don't interfere, however they are incompatible with some page sizes, so you may see some overlap. It takes a little time to get used to, but it does make some manual annotating easier, and a bit more user friendly. Any feedback is much appreciated, and if there are some bugs, let me know and I'll fix them in the next version!
Download Script
Since the HRRR data is now available on the GrADS Data Server, we'll use that. We will simply make a plot with model reflectivity. The two images below show the before and after of the plot using draw_shapes.gs.
|
|

Now, first the code to open the HRRR data from Oct 5th 2014 and plot the reflectivity (your plot may differ if you use a different data file):
file='http://nomads.ncep.noaa.gov:9090/dods/hrrr/hrrr20141005/hrrr_sfc_02z'
'clear'
'sdfopen 'file
'set gxout shaded'
'set mpdset hires'
'set lat 35 45'
'set lon -80 -65'
'set t 5'
'color 5 75 1 -kind gray->cyan->dodgerblue->blue->lime->green->darkgreen->yellow->goldenrod->orange->firebrick->red->darkred->fuchsia->indigo->white'
'd refcclm'
Once we have this set up, we run draw_shapes.gs. This will bring up a few buttons up top that will look something like this.
 |
| GUI for draw_shapes.gs |
Once you have this open, you just navigate through the buttons to add shapes as you need to. Unfortunately, I have not yet added some easy options to change some of the basic aspects of your shapes, like color or size or thickness. If you want to toggle these, I put a list of options at the top of the script for you to toggle these settings (see below).
* ***SET INITIAL VALUES***
** DEFAULT MARK VALUES**
mtype=3 ;*Mark Type (Changeable within script)
mcol=3 ;*Mark Color
msize=0.12 ;*Mark Size
* Default Line Styles
lcol=2 ;*Line Color
lstyle=1 ;*Line Style
lthick=2 ;*Line Thickness
*Default Box Styles
blcol=1 ;*Outline Color
blstyle=1 ;*Outline Style
bfcol=0 ;*Fill Color
*Default String Styles
scol=1 ;*String Color
strsiz=0.12 ;*String Size
*Default Output files
imgfile='img.png'
xpix=1000 ;*Size of png Image
ypix=750
*****
***** Special Marks *****
len=0.15 ;*Size of Special Marks
light_col=1 ;*Lightning Color
star_col=1 ;*Star Color
*********************
It is likely that in version 2.0 I will add buttons to toggle at least size and color so you can have shapes and marks of different sizes on the same plot.
Aside from that, this seems to work pretty well. I have done some testing, I tried to have the buttons set automatically based on the size of the plot, so that they don't interfere, however they are incompatible with some page sizes, so you may see some overlap. It takes a little time to get used to, but it does make some manual annotating easier, and a bit more user friendly. Any feedback is much appreciated, and if there are some bugs, let me know and I'll fix them in the next version!
Download Script


