I have not added anything to this blog as of late, I have been busy with a number of different projects including my participation in the OWLeS field project. Recently I have seen a few presentations that showed figures that had color bars made up of diamonds rather than rectangles (see below). I figured it might be fun to put together a quick script that allows you to do this in GrADS.
Example usage:
'diamondbar -r -marg 0.1 -font 0.09 -fs 2'
This is the call used to plot the colorbar on the above example.
Options: -help - Pulls up this Help Page
-loc - Chooses location for the colorbar (r=right-vertical, l=left-vertical, b=bottom-horizontal,t=top-horizontal) can also be called by (-l,-r,-b,-t)'
-size/s - sets size of each diamond, defaults to "auto"
-marg - sets margin to axis
-fs/int - sets the interval for each number plotted along the colorbar
-font/fontsize - sets the font size of the numbers
-scol - sets the color of the numbers
-line - draws outline around each diamond if included
Anyway, I had some free time recently, and I got inspired to write a new script, so I quickly put together this script. I haven't used it too much, but I certainly see how and where it could be useful, perhaps to add a little flare to your figures. Enjoy! And as always, report any bugs!
Note: The example script will generate the plot above and requires the script color.gs
Download diamondbar.gs
Download Example Script
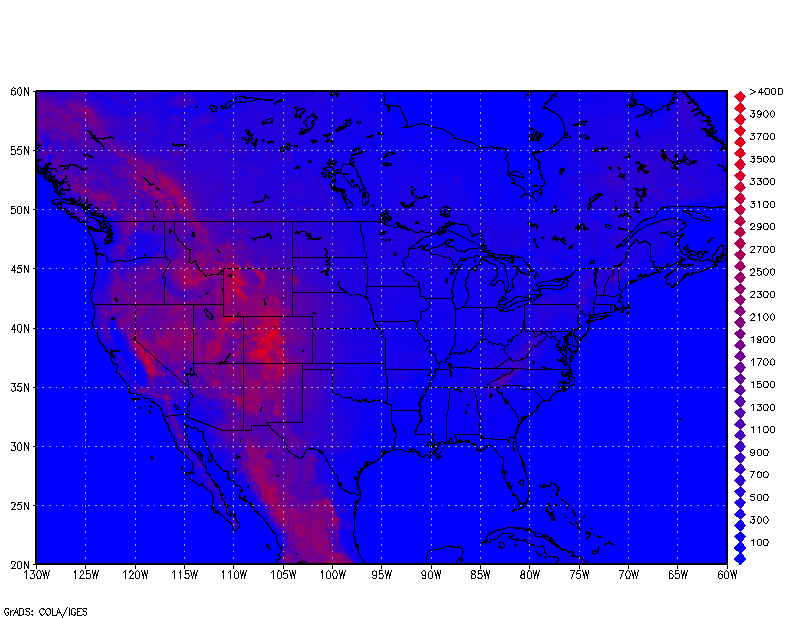 | ||||||
| Colorbar with diamonds using diamondbar.gs |
Example usage:
'diamondbar -r -marg 0.1 -font 0.09 -fs 2'
This is the call used to plot the colorbar on the above example.
Options: -help - Pulls up this Help Page
-loc - Chooses location for the colorbar (r=right-vertical, l=left-vertical, b=bottom-horizontal,t=top-horizontal) can also be called by (-l,-r,-b,-t)'
-size/s - sets size of each diamond, defaults to "auto"
-marg - sets margin to axis
-fs/int - sets the interval for each number plotted along the colorbar
-font/fontsize - sets the font size of the numbers
-scol - sets the color of the numbers
-line - draws outline around each diamond if included
Anyway, I had some free time recently, and I got inspired to write a new script, so I quickly put together this script. I haven't used it too much, but I certainly see how and where it could be useful, perhaps to add a little flare to your figures. Enjoy! And as always, report any bugs!
Note: The example script will generate the plot above and requires the script color.gs
Download diamondbar.gs
Download Example Script


