I wrote this script after I finished the script statpack.gs since most of the heavy lifting was already finished. Boxplot takes data from a user input array in the form of a string with array elements separated by spaces (same as scatter.gs) and plots out a box plot using that data. To use this script, no outside file is required. It is written such that an unspecified number of box plots can be plotted on the same plot. In most cases, this type of analysis is best left to other plotting software, but this script may be of some use in certain cases.
Example usage: Hail Reports between 1995 and 2006.
array1='64 88 127 49 175 115 128 31 190 82 229'
array2='712 595 663 777 795 1400 1375 1029 1256 1083 1015 '
'boxplot -d 'array1' -d 'array2' -range 0 1500 -enclose -cap -title -ytitle -xlab custom'
This example is for the number of small hail reports in New York and Oklahoma.
As you can gather from the above example, this script takes a whole bunch of arguments, all are listed in a help section and can be set at the top of boxplot.gs. I had other examples to present involving climatology data, but the government shutdown has made accessing this data a bit frustrating, so that has been tabled for now. For more information on how to populate an array from data contained in a GrADS .ctl file, check out the example on scatter.gs.
Notes:
Hopefully you find this script useful, this is v1.0 so be on the lookout for bugs, I have tested most of the options and I can't see any bugs as of now, but if you find some, please report them here!
Download Boxplot.gs
Download Example Script
Example usage: Hail Reports between 1995 and 2006.
array1='64 88 127 49 175 115 128 31 190 82 229'
array2='712 595 663 777 795 1400 1375 1029 1256 1083 1015 '
'boxplot -d 'array1' -d 'array2' -range 0 1500 -enclose -cap -title -ytitle -xlab custom'
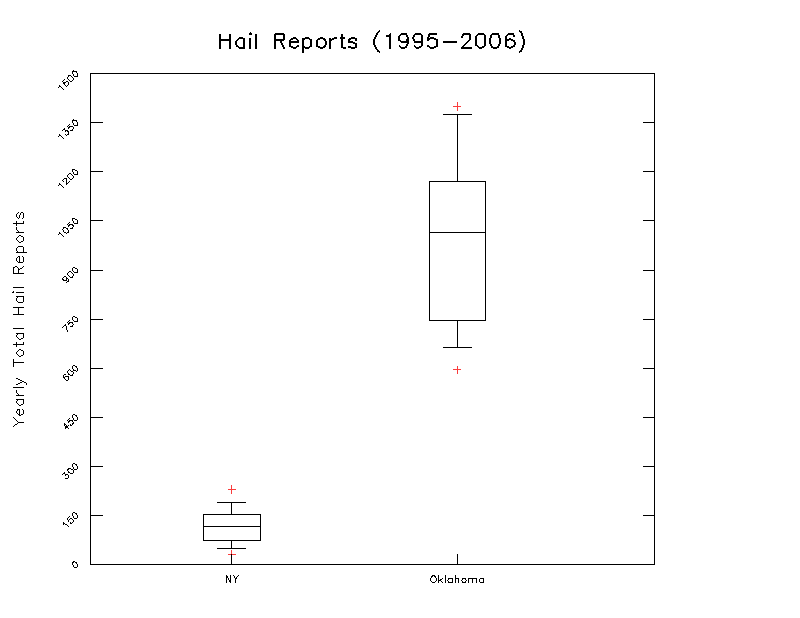 |
| Example of Boxplot.gs output: Hail Reports. |
This example is for the number of small hail reports in New York and Oklahoma.
As you can gather from the above example, this script takes a whole bunch of arguments, all are listed in a help section and can be set at the top of boxplot.gs. I had other examples to present involving climatology data, but the government shutdown has made accessing this data a bit frustrating, so that has been tabled for now. For more information on how to populate an array from data contained in a GrADS .ctl file, check out the example on scatter.gs.
Notes:
- This script can process as many arrays as you specify, as long as each array is preceded by a "-d"
- Unlike scatter.gs I did not spend a lot of time on "anti-clipping", so if you specify your data-axis (rather than leaving it on auto) you may find your data exceeding your boundaries.
- Similarly, the larger you set your boxsize, the more likely your data might exceed your plot boundaries (a boxsize <0.1 is recommended)
- The data represents the inner-quartile-range, the median, and the lines extend to the 10th and the 90th percentile [calculated using the formula used by MS Excel - q=p*(n-1)+1].
- If you turn on title plotting (-title) in your arguments, you will be prompted to enter your title, so be sure to keep an eye on your console for instructions.
Hopefully you find this script useful, this is v1.0 so be on the lookout for bugs, I have tested most of the options and I can't see any bugs as of now, but if you find some, please report them here!
Download Boxplot.gs
Download Example Script


